Project · Statistics Canada trade data
Did Canada really diversify its exports away from the US?
The US share of Canada's goods exports dropped after the 2025 tariffs. I tested how much of that drop is real diversification and how much is gold and energy.
Omar Serrano · Nov 2026
The headline
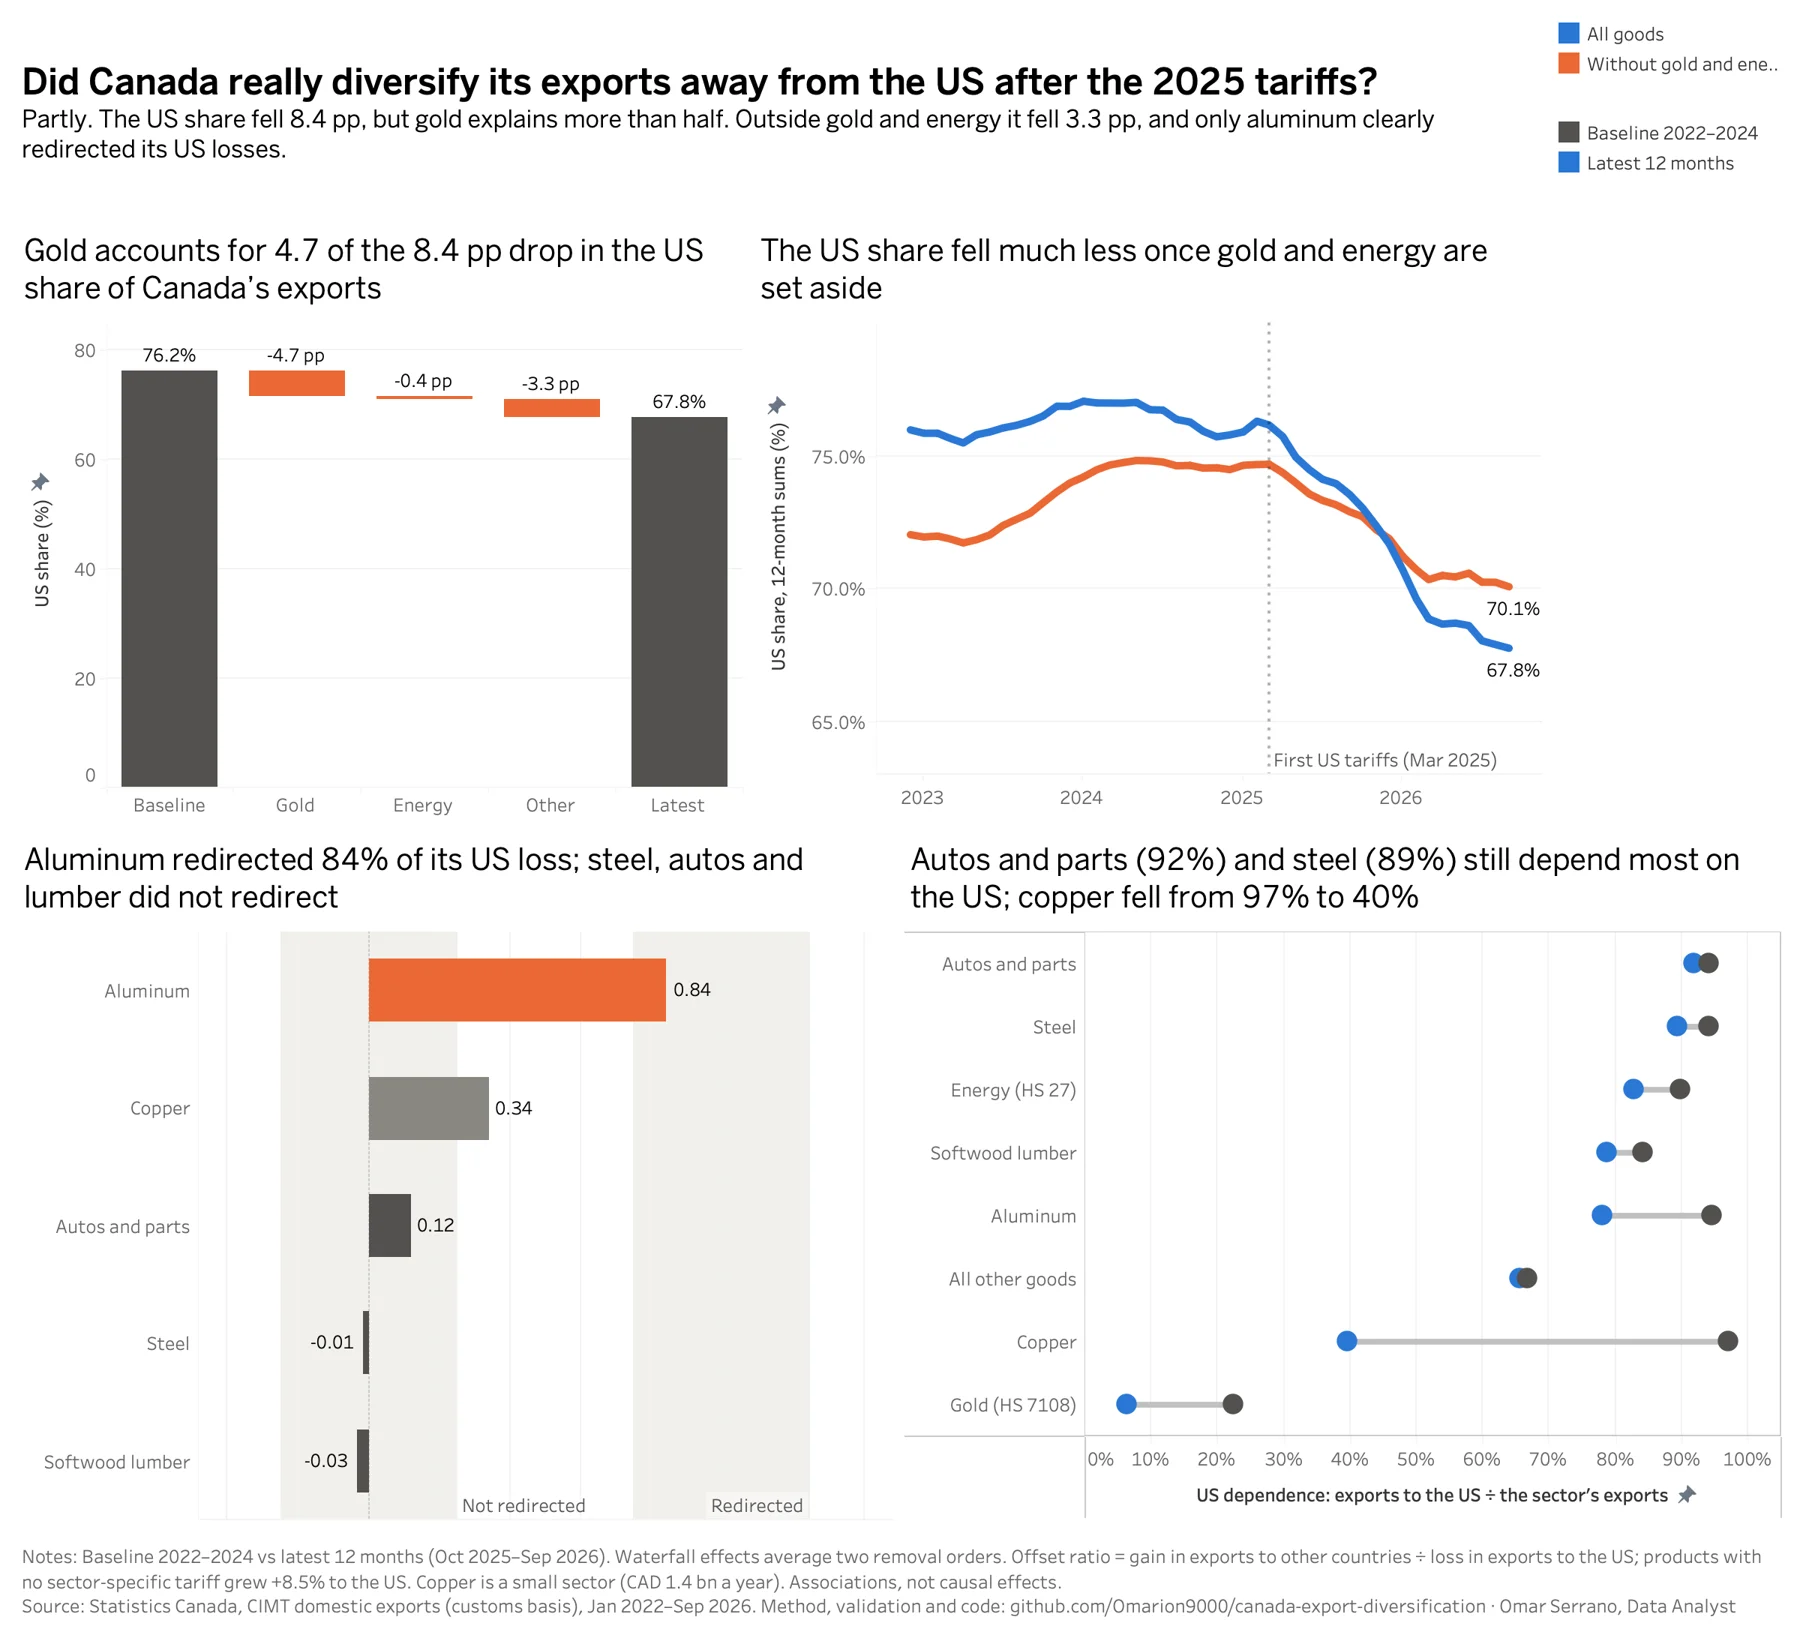
The US share fell 8.4 points
Measured with 12-month sums, the US share of Canada's goods exports went from 76.2% in the 2022–2024 baseline to 67.8% in the latest 12 months (Oct 2025 to Sep 2026).
The gold line removes gold and energy. It fell too, but much less.
US share of exports, 12-month sums (%)
Hypothesis 1
Most of the change came from other markets growing
ConfirmedExports to the US fell 3.6%, from CAD 549.2 billion a year to 529.5 billion. Exports to all other countries rose 46.9%, from CAD 171.5 billion to 251.9 billion.
About 91% of the change in the share is on the rest-of-world side, not the US side.
Exports per year, CAD billions
Hypothesis 2
Gold explains more than half of the drop
ConfirmedGold accounts for 4.7 of the 8.4 points (56%). Most of it is price: gold exports to other countries rose CAD 45.6 billion, and 77% of that is a price effect (value per gram +139%, grams shipped +28%).
Without gold and energy, the US share fell only 3.3 points.
Change in the US share, percentage points
Hypothesis 3
Only aluminum clearly found other buyers
Confirmed for 3 of 5 sectorsThe offset ratio divides what a sector gained in other markets by what it lost in the US. Aluminum gained 84 cents elsewhere for every dollar lost in the US.
Steel, autos and softwood lumber did not redirect. Copper partly did, from a small base.
Offset ratio by tariffed sector
Hypothesis 4
New export pairs rose, but stayed inside the band
Confirmed, at the edgeA new pair is a product and a non-US country whose exports grew past CAD 1 million a year. In September 2026 there were 605, 19.7% above the baseline mean of 505.5.
That is inside the ±20% band set before the analysis, but only 1.6 pairs below the limit, so a moderate rise cannot be ruled out.
New product–country pairs outside the US
Sector exposure
Autos and steel still depend most on the US
Autos and parts (92%) and steel (89%) still send most of their exports to the US.
Copper changed the most, from 97% to 40%, but it is a small sector (CAD 1.4 billion a year).
Share of each sector's exports going to the US (%)
US share of exports, 12-month sums (%)
1 / 6
How I checked it
Monthly Statistics Canada data, January 2022 to September 2026, 5,382 products and 224 destinations. Every total was compared with published Statistics Canada tables before any result, and all thresholds were written down before looking at the data.
Source: Statistics Canada, Canadian International Merchandise Trade (domestic exports, customs basis).
Limits
- Description, not cause. The results show what changed alongside the tariffs; they do not prove the tariffs caused it.
- Gold is volatile. It depends on world prices and on where bullion is refined and stored.
- Exports surged before the tariffs. November 2024 to February 2025 are left out of both periods.
Opens the live Tableau Public view here.